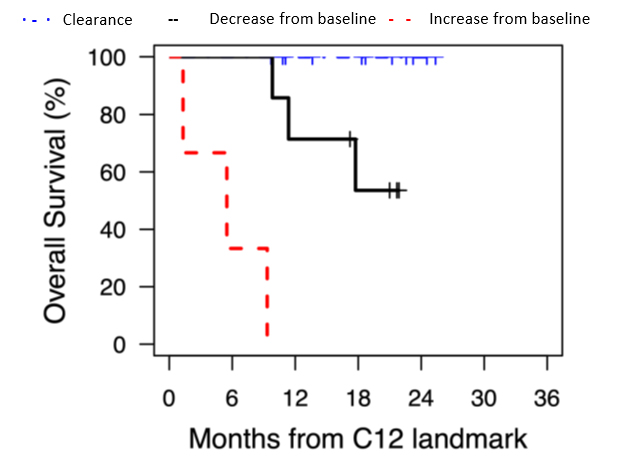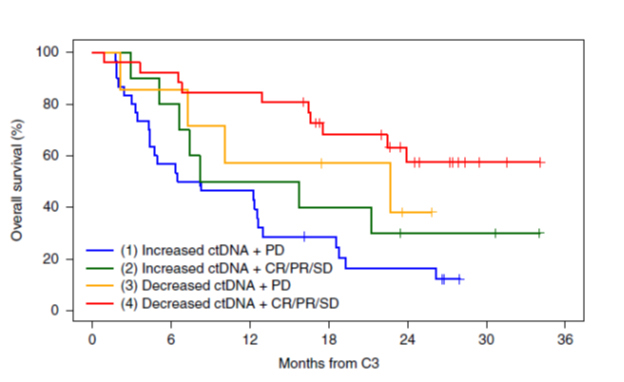
The test also identifies treatment nonresponders with a 100% positive predictive value. A rising ctDNA and progressive disease on imaging predicted treatment nonresponse with 100% accuracy. See Figure B for overall survival rates for different risk groups defined by both ctDNA responses and response criteria based on imaging.
Figure B. Overall survival rates based on ctDNA and response criteria based on imaging. Reprinted with permission from Bratman SV et al. Nature Cancer. 2020:1:873-881. C3 = cycle 3; CR = complete response; SD = stable disease; PD = progressive disease.

